FTP Cycling Chart: Unlock Your Power Zones 2026
You bought the power meter, paired it to your Garmin or Wahoo, rolled out for the first ride, and suddenly your screen filled with numbers that felt important but not very useful. Instant watts jump around. Average power tells part of the story. Normalized power shows up after the ride. Then someone tells you to train by FTP, and now you’re deep in charts, acronyms, and zone labels.
That confusion is normal.
A power meter only becomes helpful when you anchor those numbers to your current fitness. That anchor is Functional Threshold Power, usually shortened to FTP. Once you have it, an FTP cycling chart stops being a random table and becomes a map. It tells you what easy should feel like, where steady endurance lives, and how hard threshold or VO2 work should be on the bike tomorrow.
Table of Contents
- Your Power Meter Is Installed Now What
- Decoding the FTP Cycling Chart Your Power Zones Explained
- How to Find Your FTP An Accurate Testing Guide
- Putting Your Power Zones into Practice Example Workouts
- From Text to Training Syncing Workouts to Your Device
- Common FTP Questions Answered
Your Power Meter Is Installed Now What
The first mistake most new power users make is treating every watt reading as equally important. It isn’t. If your display says 287 watts for a few seconds on a small rise, that number means almost nothing by itself. The same goes for 164 watts while soft-pedaling out of a corner.
What matters is context.
A rider who has just installed a power meter usually goes through the same sequence. First ride, lots of curiosity. Second ride, lots of staring at numbers. Third ride, a bit of frustration because nothing seems consistent. The breakthrough comes when they stop asking, “What watts am I doing right now?” and start asking, “What kind of effort is this relative to my capacity?”
That’s where FTP comes in. Think of it as the translation key for your power data. It turns raw watts into training zones you can use. Instead of seeing “220 watts,” you start seeing “steady endurance.” Instead of “295 watts,” you recognize “near threshold, this needs focus.”
Practical rule: Your power meter measures output. Your FTP helps you interpret it.
Once you know your FTP, an FTP cycling chart gives each ride a purpose. Easy rides stay easy. Moderate work stops drifting too hard. Hard intervals become specific instead of random suffering. That’s a major shift for a motivated rider who wants more than just collecting files on Strava.
There’s also a mental benefit. You stop comparing every ride to someone else’s screenshot. You start training from your own numbers, your own zones, and your own progression. That’s a much healthier way to build fitness.
Decoding the FTP Cycling Chart Your Power Zones Explained
You finish an interval, glance at your head unit, and see a number that looks precise enough to mean something important. The chart is what turns that number into a decision. Back off. Hold steady. Push for two more minutes. Recover.
An FTP cycling chart divides your effort into training zones based on your current ability. It works like a legend on a map. Without it, power is just a stream of numbers. With it, you can tell whether 220 watts is recovery, endurance, or work that needs real focus.
What FTP means in plain English
FTP is the reference point used to set those zones. In practical terms, it is the anchor for your training targets. Once that anchor is set, every ride becomes easier to pace and every workout becomes easier to judge.
A useful comparison is a thermostat. The room temperature number only helps if you know what range counts as cool, comfortable, or too hot. FTP does the same job for cycling power. It gives meaning to the number on the screen.
You will also see riders talk about FTP in watts per kilogram. That version helps with comparison, especially on climbs, because it relates power to body weight. It can be interesting context, but for day-to-day training, your zone chart matters more than how your number stacks up against someone else’s.
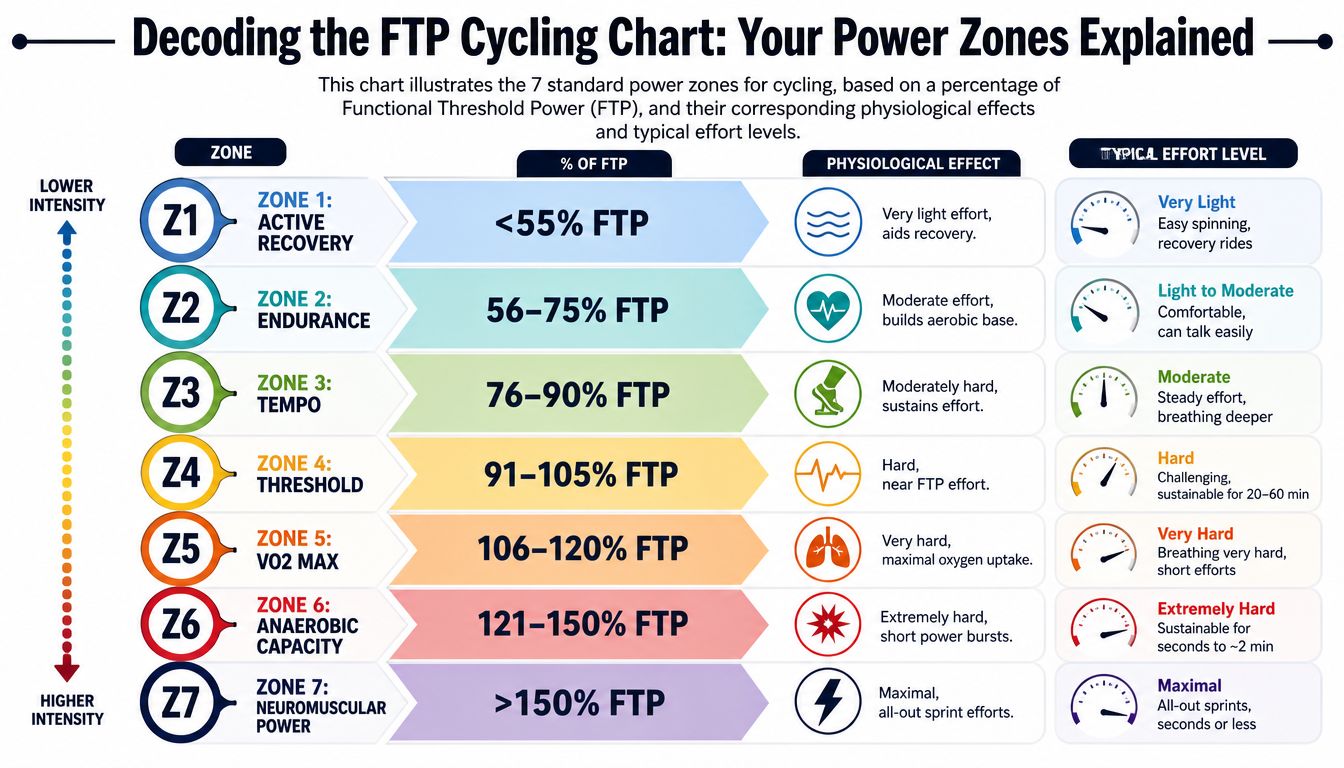
Standard cycling power zones based on FTP
| Zone | Name | % of FTP | Primary Purpose |
|---|---|---|---|
| 1 | Active Recovery | <55% | Recover between hard sessions |
| 2 | Endurance | 56-75% | Build aerobic base |
| 3 | Tempo | 76-90% | Improve sustained sub-threshold power |
| 4 | Threshold | 91-105% | Raise ability to hold hard steady efforts |
| 5 | VO2 Max | 106-120% | Develop high aerobic power |
| 6 | Anaerobic Capacity | 121-150% | Train short, hard bursts |
| 7 | Neuromuscular Power | >150% | Sprint and maximal acceleration work |
If you want to turn your FTP into exact watt targets for each zone, this FTP zone calculator for cycling power training is a quick way to do it.
How to read the chart without overthinking it
The easiest way to understand zones is to ask one question. What is this effort trying to improve?
-
Zone 1, Active Recovery: Very easy riding. You use this to promote recovery, keep the legs moving, and avoid turning an easy day into hidden fatigue.
-
Zone 2, Endurance: Steady aerobic work you can hold for a long time. This is where riders build durability, pacing control, and the ability to keep producing power without burning too many matches.
-
Zone 3, Tempo: Controlled pressure. You are working, but you are not on the limit. Tempo is useful when you want sustained training load without the cost of repeated threshold sessions.
-
Zone 4, Threshold: Hard, steady, and mentally demanding. This zone improves your ability to hold a strong pace on climbs, in time trials, or during long pulls where backing off is not an option.
Riders new to structured training often drift here too often. Threshold is productive, but it cannot be the default setting for every ride.
-
Zone 5, VO2 Max: Short, demanding intervals with deep breathing and a strong sense of urgency. This work raises your high-end aerobic power and helps with repeated hard efforts.
-
Zone 6, Anaerobic Capacity: Very hard surges that rely heavily on short-term power. These efforts show up in attacks, steep ramps, and punchy race situations.
-
Zone 7, Neuromuscular Power: Maximal sprinting and acceleration. The goal here is not pacing. It is full recruitment, sharp technique, and quality.
One area that often confuses newer riders is sweet spot. It usually sits around the top of Zone 3 and the lower edge of Zone 4, often described as roughly 88 to 94 percent of FTP. Coaches use it because it gives a lot of productive work without the same recovery cost as spending all your hard days at threshold.
That is the theory. The practical question is what to do with it. If your notes say “3 x 12 minutes at 90 percent” or “5 x 4 minutes in Zone 5,” the next step is turning that chart into a workout file your Garmin or Wahoo can guide you through on the road or trainer. That is the part many FTP guides skip, even though it is what makes structured training easy to follow tomorrow.
How to Find Your FTP An Accurate Testing Guide
You head out for your first structured session with a target of 210 watts, but ten minutes in you are either hanging on for dear life or wondering why the workout feels too easy. In both cases, the same problem is usually hiding underneath. Your FTP estimate is off.
That number is the reference point for the whole chart, so it needs to be close enough to guide training well. It does not have to be laboratory perfect. It has to be useful.
The test most riders use
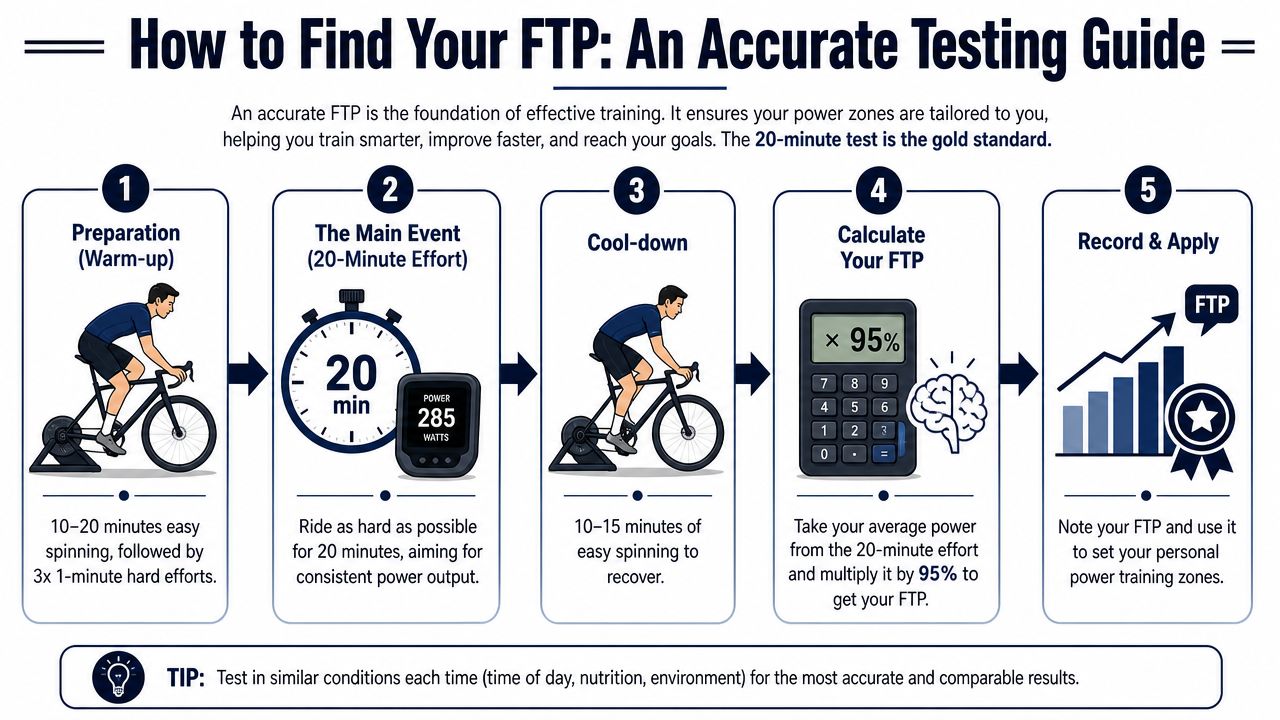
The standard starting point is the 20-minute maximal effort test. The idea is simple. After a proper warm-up, you ride as hard as you can sustain for 20 minutes, then take 95% of your average power for that effort to estimate FTP.
That formula is a shortcut. It works like using a well-marked trail instead of bushwhacking your own route. It may not be exact for every rider, but it gives you a practical number you can train with.
Some riders also include a hard 5-minute effort before the main test. The purpose is to reduce the impact of fresh-leg punch, so the 20-minute effort reflects aerobic strength more than a short burst of anaerobic power.
A simple testing routine
A solid test day usually follows this sequence:
-
Warm up long enough to feel ready. Start easy, then build gradually. Add a few short efforts so your legs and breathing are awake before the main test.
-
Do the optional hard clearing effort if your protocol calls for it. This helps riders who tend to start too hard and overestimate what they can truly hold.
-
Ride the 20 minutes as evenly as possible. The first few minutes should feel controlled, not heroic. If you surge early, the final ten minutes often turn into damage control.
-
Record average power for the full effort. Ignore your best one-minute or five-minute number. FTP is about what you can sustain.
-
Multiply that average by 0.95. The result is your estimated FTP.
Other protocols exist, including ramp tests and shorter repeated efforts. They can work well, especially if you use the same method each time and compare results under similar conditions.
This video gives a useful demonstration of the process:
For a more detailed walkthrough, this cycling FTP test guide is a helpful companion.
How much trust to place in the result
Treat your first result as a starting setting, not a verdict.
That distinction is important because FTP tests estimate a training benchmark. They do not capture every detail of fatigue resistance, pacing skill, indoor versus outdoor conditions, or how you perform on a given day. Two riders can post the same test result and still experience threshold workouts very differently.
A simple sanity check helps. If your supposed threshold power makes every threshold workout fall apart halfway through, your FTP is probably set too high. If threshold intervals feel suspiciously comfortable week after week, it may be set too low.
Newer riders often struggle most with pacing. They go out too hard, fade badly, and end up with a number that reflects the first five minutes more than the full effort. That is why consistency matters so much. Test on similar equipment, in similar conditions, and with the same protocol each time.
Then do the practical coach thing. Use the number for a few weeks, watch how the zones feel in real workouts, and adjust if needed. Once the estimate is close, the next step is not more theory on paper. It is getting those power targets into a workout file your Garmin or Wahoo can follow, so tomorrow’s ride is guided clearly from the first interval to the last.
Putting Your Power Zones into Practice Example Workouts
A chart becomes valuable when it gives shape to a ride. The easiest way to learn that is to match common goals to specific sessions.
A steady ride for aerobic fitness
You want to finish long rides stronger and stop fading late.
Ride mostly in Zone 2. Keep the effort steady enough that you can speak in full sentences and stay disciplined on climbs. If your usual endurance rides drift upward every time the road tilts, this is the session to clean that up.
A simple version is:
- Warm up easily
- Ride steadily in Zone 2 for the main portion
- Spin home in Zone 1
This kind of session looks unimpressive on paper, but it teaches control and builds the aerobic foundation that supports everything else.
A sweet spot session for getting stronger without blowing up
You want a workout that feels productive but doesn’t wreck the next few days.
Use sweet spot, which sits just under threshold. In practical terms, this is the range many riders can repeat consistently while still accumulating solid work. It’s a favorite for time-crunched cyclists because it’s demanding without being completely draining.
A beginner-friendly example:
- Warm up
- Ride 3 efforts of 10 minutes at sweet spot
- Pedal easily between efforts
- Cool down
If that goes well for a few weeks, you can progress by extending the work periods or making the effort more continuous.
A VO2 workout for top-end power
You want to climb punchier hills better, respond to attacks, or build the ability to repeat hard surges.
That points to Zone 5 work. These intervals should feel very hard, but not chaotic. The target is high aerobic strain with enough control to finish each effort properly.
One classic format:
- Warm up thoroughly
- Do several short efforts in Zone 5
- Recover with easy spinning
- Finish with an easy cool-down
This is not a session to improvise when you’re already tired. Save it for a day when you can hit the intended effort.
The best interval session is the one you can execute as planned, not the one that looks toughest in your notes app.
A threshold workout for climbing and sustained efforts
You want to hold a hard pace on long drags, solo efforts, or long climbs without fading.
That’s where Zone 4 helps. Threshold intervals teach you to stay composed while producing sustained power near your limit.
A straightforward option:
- Warm up well
- Ride 2 sustained efforts near threshold
- Take easy spinning between efforts
- Cool down
Pacing is the most important factor. Start too hard and the whole session turns into survival. Start controlled and you’ll often finish stronger than you expected.
From Text to Training Syncing Workouts to Your Device
Most FTP articles stop at the workout example. That’s useful, but it misses the moment where many riders stall out. They know what they’re supposed to do, yet the session never quite makes it onto the head unit in a form they can follow.
Why this part frustrates so many riders
The old workflow is clumsy.
You write “3 x 10 min at sweet spot with easy spinning between” in a notebook, in TrainingPeaks notes, or in your phone. Then you open Garmin Connect or a Wahoo workout builder and rebuild the whole thing block by block. Add the warm-up. Add the work interval. Add the recovery. Repeat the set. Check the targets. Save it. Sync it. Hope it appears correctly on the device before you leave.
That friction matters because it turns a simple training idea into admin.

Riders who love structure often tolerate that process for a while. Riders who are busy usually don’t. They end up riding from memory, glancing at a paper note taped to the stem, or skipping the structured session entirely because building it feels like another task at the end of a workday.
A faster way to go from note to head unit
There’s a cleaner approach.
TextFit is built around plain-language workout creation. Instead of dragging workout blocks around a builder, you write the session the way a coach or athlete naturally would. Something like “warm up easy, then 3 x 10 min at 90% FTP with 5 min easy between, then cool down.” The system parses the text, turns it into a structured workout, lets you review it, and prepares it for device sync.
That matters for cyclists because most workouts start life as text anyway. They begin as a note from a coach, a copied session from a training article, or a message you sent yourself after a good idea during a ride.
A text-first workflow solves several practical problems:
- Less translation: You don’t have to convert plain English into builder logic by hand.
- Cleaner execution: The workout on your Garmin or Wahoo matches the plan more closely.
- Better consistency: It becomes easier to do structured sessions the way you intended, especially on busy days.
- Useful for coaches and self-coached riders: Both groups deal with written workout instructions constantly.
If you want to see that workflow in more detail, this workout plan builder overview shows how text-based creation fits into day-to-day training.
Its primary value is not novelty. It’s reducing the gap between “I know what workout I should do” and “my device is ready, and I’m riding it now.”
Common FTP Questions Answered
How often should you re-test
A good re-test is timed to your training, not the calendar.
Re-test at the start of a new block, after several weeks of steady training, or when your workouts stop matching the target. If sweet spot work suddenly feels like threshold, your FTP may be set too high. If threshold intervals feel controlled for multiple sessions in a row, it may be set too low.
New riders often see faster changes because early fitness gains come quickly. More experienced riders usually need a longer stretch of consistent work before a new test shows a meaningful shift.
What if the zone feels wrong on the day
Use the chart as a guide, then coach yourself accurately.
Your FTP zones work like speed limits on familiar roads. They help you pace the ride, but they do not erase heat, poor sleep, stress, bad fueling, or lingering fatigue. If endurance power feels strangely hard, reduce the target and protect the purpose of the session. If a hard day keeps feeling too easy across several workouts, review your FTP rather than forcing every interval higher on the spot.
This is also where execution matters. A workout that is clear on paper is much easier to judge correctly when it appears cleanly on your head unit instead of living in a half-remembered note.
Why watts per kilogram matters
Raw watts show how much power you can produce. Watts per kilogram show how much power you can produce for your body weight.
That second number matters most when gravity is the main opponent. On climbs, a lighter rider with a lower raw FTP can still ride away from a heavier rider because each kilogram is costing less power to move uphill. On flat roads, raw power and aerodynamics often matter more.
Use watts per kilogram for context, not self-worth. Public charts can help you understand broad categories, but they do not know your training age, race goals, body type, or how consistently you have trained.
Can you use the same idea for running
Yes, but the chart does not carry over directly.
Running training uses the same basic logic. You estimate a threshold, divide training into intensity ranges, and assign workouts to the right range. The actual metrics are different, though. Running plans usually rely on running power, pace, heart rate, or a combination, so a cycling FTP chart should stay in the cycling toolbox.
What if I’m new and the benchmarks feel discouraging
That feeling is common.
A benchmark chart can be useful, but it can also confuse a newer rider who is comparing a first season of structured training to athletes with years of steady work behind them. A better comparison is between your current workouts and your workouts from six to eight weeks ago. Are you holding the target more smoothly? Recovering better between intervals? Finishing sessions with more control? Those are real signs of progress.
If you are self-coached, there is one more practical step that often gets missed. Once you know your zones, make the next ride easy to execute. Write the workout in plain language, get it onto your Garmin or Wahoo, and let the device handle the prompts while you focus on pedaling. That turns FTP from an interesting number into training you can readily do tomorrow.
If you already have workouts written in plain language and you’re tired of rebuilding them step by step in Garmin Connect or other workout editors, TextFit is worth a look. It turns simple written sessions into structured workouts you can review and sync to supported devices, which makes it much easier to move from an FTP cycling chart on paper to a workout you can follow on the road or trainer.